- Published on
- • 17 min read
Renting a GPU to run an LLM
- Authors

- Name
- Ching Chew
- Socials
My 2019 MacBook Pro works well for most of what I do but it is underspeced when it comes to running larger LLMs. As part of my LLM learning path, I want to deploy Llama 3.1 70B (AWQ 4-bit) on vLLM on a rented RunPod pod, load-test it, add a backpressure gateway and a watchdog, then break it three ways (overload it past the backpressure limit, kill the server mid-generation, force an out-of-memory) and measure how fast it recovers.
RunPod is the cloud platform I am showing but every step has an AWS, Azure and GCP equivalent, mapped as it comes up. The code is at github.com/cchew/llm-deployment-lab (MIT); clone it and run it if you want to follow along.
The headline numbers, measured on a single RTX A6000:
- Peak aggregate throughput across concurrent requests: 263.5 tokens per second.
- Watchdog recovery, from killing the server process to a healthy endpoint again: 102.1 seconds.
- Concurrency at which the error rate crossed the gateway's saturation threshold: 32.
All three are at tensor-parallel-size 1 on one GPU because I couldn't get the two-GPU design to work on that hardware; that story is below. They are single measurements from one pod on one host class, so treat them as directional, not as benchmarks.
This post assumes the vocabulary from the companion piece, Running your own LLMs (for beginners). If terms like KV cache, TTFT or tensor parallelism are new, start there.
The shape of it
Six key steps:
- Rent a pod: a GPU host with a driver and an SSH port.
- Deploy an engine: vLLM, serving the model over an OpenAI-compatible HTTP API.
- Load-test it: drive concurrent requests until throughput flattens and latency climbs.
- Add a backpressure gateway: a thin proxy that returns HTTP 429 once in-flight requests cross a limit, instead of letting the server degrade silently.
- Add a watchdog: poll the health endpoint, relaunch the server after repeated failures.
- Break it on purpose: concurrency saturation, a mid-generation kill, a forced out-of-memory. Measure recovery.
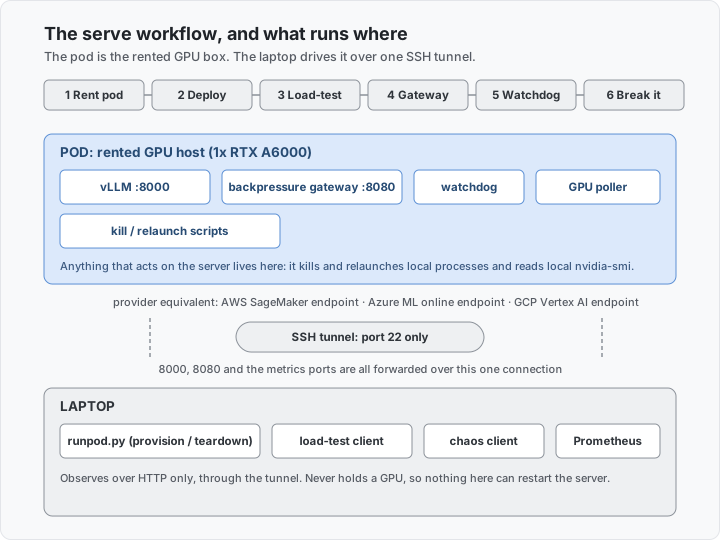
Image 1: what runs where. Anything that acts on the server sits on the pod; the laptop only observes, over the tunnel.
Anything that acts on the server (the launch scripts, the watchdog, the gateway, the GPU poller) runs on the pod, because that is where the process tree and the GPUs are. Anything that only observes over HTTP (the load-test client, the chaos client, Prometheus) runs on the laptop, reaching the pod through an SSH tunnel.
Why not a managed model service
Bedrock, SageMaker JumpStart, Azure AI Foundry and Vertex Model Garden will all serve Llama 70B behind an endpoint with none of this additional effort, and if one fits your constraints you should use it. This post is the self-managed path on purpose. The managed services hide exactly the layer it is about: the driver and CUDA pinning, the tensor-parallel topology, the backpressure and restart behaviour. You do not see those, or get to tune them, behind a managed endpoint. Self-hosting also travels into places a multi-tenant inference API cannot, which for a government PROTECTED workload is often the deciding factor.
Renting the GPU
Three things decide whether a model runs on a given card.
VRAM. Llama 3.1 70B at AWQ 4-bit is roughly 40 GB of weights, before the KV cache. One 48 GB card holds it with room for a modest context window; two give real headroom. A 24 GB card does not fit it at all.
Compute capability. The GPU architecture generation: sm_80 for Ampere, sm_90 for Hopper. Kernels are compiled against it, and some paths are gated to newer hardware regardless of free memory. Hardware-native FP8 matrix multiply, for instance, is Ada and Hopper only, so on an Ampere card like the A6000 that path is off no matter how much VRAM is spare.
The driver and CUDA ceiling. The host driver caps the CUDA version any container on that host can use. Get this wrong and the pod fails on first real kernel launch, not at import.
Cloud platforms offer different GPUs (or SKUs) on their catalogue: for example AWS has A10G but RunPod's nearest picks are the RTX A5000 (24 GB) and the RTX A6000 (48 GB), and the lab defaults to two A6000s. The provisioning surface differs by provider, but the decisions do not:
| Decision | RunPod | AWS | Azure | GCP |
|---|---|---|---|---|
| Rent the machine | pod (deploy/runpod.py) | SageMaker endpoint or EC2 | Azure ML online endpoint | Vertex AI endpoint or GCE |
| Pick the GPU | gpuTypeIds | instance type (g5, p4d) | VM SKU (NC, ND series) | accelerator type (nvidia-l4, a100) |
| Constrain the host driver | allowedCudaVersions | Deep Learning AMI or DL container | curated environment | Deep Learning VM image |
| Reach the server privately | SSH tunnel, port 22 only | VPC or private endpoint | private endpoint | private endpoint |
Since each provider offers different SKUs, the wrapper around the GPU, not the model, is where you spend your time.
The nine bugs
Here is every bug the live run surfaced. None of them showed up against the mock servers the lab was built and tested on. The sections that follow expand the ones worth unpacking; the whole list doubles as a pre-flight checklist if you are writing your own scripts.
- No CUDA-driver host filter. An unfiltered pod-create can land on a driver too old for the pinned vLLM build. Fix:
allowedCudaVersionsplus a pinned, pre-baked image. - The kill script missed
VLLM::Workerprocesses. It reported "none" while two 45 GB workers still held both GPUs, which would have corrupted every downstream MTTR reading. flashinfer-python0.6.16.post3 crashes on Python 3.11, on an eagerly evaluatedarray.array[int]type-hint subscript. Fix:from __future__ import annotations.torchcodecraises an unguardedOSErrorthat crashes the vLLM CLI instead of hitting vLLM's own import fallback. Removed; unused for text-only serving.- NCCL peer-to-peer hangs indefinitely under TP=2 on a PCIe-only host, reproduced across two hosts and two vLLM versions. Not fixed. Worked around by running at TP=1.
- The load-test and chaos clients hardcode
"model": "default". vLLM 404s on anything but the exact model id unless aliased, and every request 404'd on the first run, invisibly, because the error-rate calc only counted 5xx. Fix:--served-model-name default. - The watchdog's restart script had drifted from the launch script: still hardcoded TP=2, still missing
--served-model-name. A triggered restart would have silently regressed the server. - The saturation scenario could not detect its own pass condition. It reused the 5xx-only error definition to score a test whose entire purpose was to trigger 429s. Fixed by counting 429s.
- The watchdog's
--restart-cmdtakes separate argv words, not a shell string. Passed as one quoted string over SSH, it became a one-element list with an embedded space, whichsubprocess.runtreated as a single nonexistent filename. Silently disabled auto-recovery.
Pin your driver and CUDA before anything else
This is bug 1, the one most likely to cost you an afternoon.
deploy/runpod.py originally had no way to ask for a driver-compatible host, and launch_vllm.sh ran an unpinned pip install -U vllm. A create call landed on a host with a driver capped at CUDA 12.4; the vLLM that pip resolved wanted CUDA 13. pip install succeeded. The import succeeded. The server got most of the way up and then failed at the first real kernel launch, with an error that named a missing native library rather than the version mismatch underneath it.
Two changes fix it. First, bake the exact vLLM version into a Docker image and push it, so every fresh pod starts from a known build instead of resolving pip install live. Second, pass RunPod's allowedCudaVersions filter on pod-create, so the scheduler only places you on a host whose driver clears that CUDA version.
# deploy/runpod.py
DEFAULT_IMAGE = "ghcr.io/cchew/llm-deployment-lab-vllm:0.27.1"
# vllm==0.27.1 ships a cu13x torch build; it needs host driver >=580.xx.
# allowedCudaVersions is a fixed enum allow-list (from the OpenAPI schema),
# not a ">=" filter, so "13.0" is the whole list needed to guarantee a
# host whose driver can run the pinned image.
DEFAULT_CUDA_VERSIONS = ["13.0"]
The image pin and the host filter are two halves of one guarantee. The filter promises a driver that can run CUDA 13. The pinned image is what makes sure the vLLM you actually installed needs exactly that, and not something newer that a later release quietly bumped to.
Every provider has this control under a different name: Deep Learning AMI or a pinned deep-learning container on AWS, curated environment on Azure ML, Deep Learning VM image on Vertex.
Serving the model
The launch line, run on the pod:
# deploy/launch_vllm.sh
HF_HOME="$MODEL_CACHE" vllm serve "$MODEL" \
  --served-model-name default \
  --tensor-parallel-size "$TENSOR_PARALLEL_SIZE" \
  --max-model-len "$MAX_MODEL_LEN" \
  --port "$PORT" \
  --gpu-memory-utilization 0.90 \
  --download-dir "$MODEL_CACHE"
vllm serve starts an OpenAI-compatible HTTP server: /v1/completions, /v1/chat/completions and a /health endpoint, the same shapes as the hosted APIs, so existing client code mostly works against a new base URL. Three flags are worth knowing.
--served-model-name default gives the model a short, stable alias. Without it, clients send the full Hugging Face id as the model field on every request; with it, "model": "default" works and the underlying id can change without touching client code. (Skip the alias and a name mismatch 404s every request. That is bug 6; it went unnoticed for a whole run, for the reason in the list above.)
--gpu-memory-utilization 0.90 tells vLLM to claim 90 percent of VRAM for weights plus KV cache and leave the rest for the CUDA context and activation spikes. On a 48 GB A6000 holding ~40 GB of AWQ weights, that leaves enough KV cache for useful concurrency; push it to 0.95 and a long prompt can tip the server into OOM mid-run.
--max-model-len 8192 caps the context window, and with it the per-request KV cache. The model is trained for more, but every token of window you allow is VRAM you are not spending on serving more requests at once.
Confirm it is actually up before trusting any later number: curl localhost:8000/health returns 200 once the weights are resident, and one real request to /v1/completions with "model": "default" should stream tokens back. If that 404s, the alias is wrong. Several failures in this post are that shape: not a crash, just a number that looks fine and is not.
Load testing and backpressure
The baseline run goes straight to vLLM and drives concurrent streaming requests, stepping concurrency 1, 2, 4, 8, 16, 32. Aggregate throughput climbs the whole way, from 16.6 tokens per second at one request to 263.5 at 32. Time-to-first-token tells the other half: flat around 530 ms up to concurrency 8, then it roughly doubles to 1.3 seconds and holds there. Past 8, extra concurrency still buys throughput, but it buys it with latency.
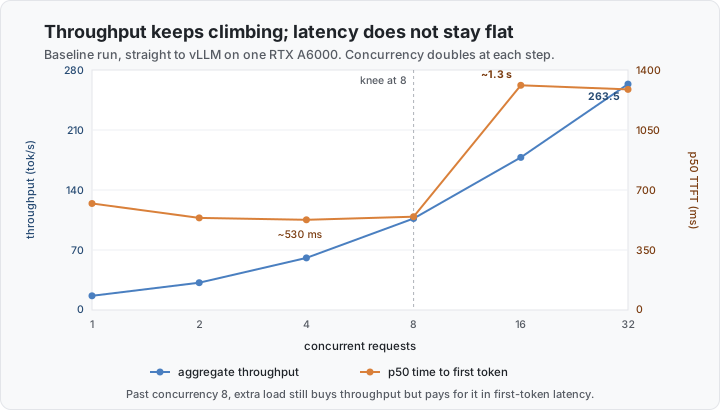
Image 2: baseline load test, direct to vLLM. The knee at concurrency 8 is where added load stops being free.
The GPU trace over the same run: 92.8 percent peak memory used, 100 percent peak utilisation, 76 C peak, no thermal throttling. The card was saturated; what the numbers past concurrency 8 measure is the queue in front of it.
The backpressure gateway is a thin FastAPI proxy that sits in front of vLLM. It counts in-flight requests and returns 429 with a Retry-After header once the count passes MAX_IN_FLIGHT, so a caller under overload gets a fast, explicit rejection instead of a slow, silent degradation.
# gateway/backpressure_gateway.py
@app.post("/v1/{path:path}")
async def proxy(path: str, request: Request) -> Response:
    if app.state.in_flight >= MAX_IN_FLIGHT:
        return Response(
            content='{"error":"backpressure: queue depth exceeded"}',
            status_code=429,
            media_type="application/json",
            headers={"Retry-After": "1"},
        )
    app.state.in_flight += 1
    # ... stream the request upstream, decrement in_flight when it finishes
It only does that if it is actually in the request path. A related trap, not one of the nine: on the first attempt the saturation run pointed straight at vLLM on port 8000, so the gateway was up but no traffic reached it. The runbook now sends the saturation run through the gateway on 8080 and the other two chaos scenarios direct, since those want vLLM's own unshielded failure behaviour.
Through the gateway, the error rate holds at zero up to concurrency 16 (the in-flight limit), then jumps to 60 percent at 32 and 64: the gateway is shedding load with 429s exactly as designed. Concurrency 32 is where it first breaks, twice MAX_IN_FLIGHT. Read that as a number for this configuration, not a hardware constant: it moves with the in-flight limit, the prompt sizes and where you draw the error-rate line. The reusable part is the method, not the 32.
The watchdog
The lab reports one recovery number: how long the server stays down after a crash before the watchdog has it answering again. The first version of that measurement was close to useless. It timed the gap from the kill to the moment the watchdog issued a restart command, which is not recovery: it is a fixed function of the poll interval and the failure threshold. At a 5-second poll and 3 consecutive failures it is always about 15 seconds, whatever the server does next. A 70B checkpoint takes minutes to load. The real interval is from the kill to the first healthy health-check after the restart, and that is what measure_mttr reads out of the watchdog log. Measured that way: 102.1 seconds.
The watchdog itself is a poll loop:
# watchdog/watchdog.py
def check_health(client: httpx.Client, health_url: str) -> bool:
    try:
        resp = client.get(health_url, timeout=5)
        return resp.status_code == 200
    except httpx.HTTPError:
        return False

# Each failed check increments a counter. Once it hits failure_threshold
# the watchdog runs the restart command, unless a restart already fired
# inside the last restart_cooldown_s (300s):
    now = datetime.now(timezone.utc)
    if in_cooldown(state, restart_cooldown_s, now):
        # Keep counting failures so a restart fires promptly once the cooldown
        # lapses, but don't stack another relaunch on top of the one still
        # loading the model.
        return state.model_copy(update={"consecutive_failures": failures, "is_healthy": False})
    restart(restart_cmd)
The 300-second cooldown is the load-bearing line. While the checkpoint reloads the health endpoint is legitimately down, and without the cooldown the watchdog reads that window as a fresh outage and fires a second relaunch into the first, with the two fighting over the same GPUs.
Two things nearly broke this before it ran once. The restart script had been copied from the launch script months earlier and had drifted: it still hardcoded tensor-parallel-size 2 and was still missing --served-model-name, so a watchdog-triggered restart during the single-GPU run would have brought the server back in a broken configuration (bug 7). Caught by reading it, not by a failure. And the watchdog's --restart-cmd takes separate argv words, not a shell string. Passed as one quoted string over SSH, it collapsed to a one-element list with an embedded space, which subprocess.run then treated as a single filename that did not exist (bug 9). Operator error, not a code bug, but it silently took the watchdog offline mid-session with nothing watching the server.
Breaking it on purpose
Three scenarios.
Concurrency saturation, through the gateway. Ramp concurrency against the gateway until the 429s start. It found the break at 32 and fired 48 rejections there. Getting the scenario to score that correctly, rather than read 48 successful backpressure responses as a clean run, was bug 8.
Mid-generation kill, direct to vLLM. Kill the server process partway through a load test, let the watchdog notice and relaunch, measure the gap. This is where 102.1 seconds comes from. Sharp edge: measure_mttr needs the healthy tick that lands after the restart, so the watchdog log has to be pulled down once the server is answering again, not before. Pull it early and it returns nothing.
Forced out-of-memory, direct to vLLM. Over-provision the context length and observe whether the server crashes outright or rejects the request cleanly.
Tensor parallelism, and when to give up on it
The design targeted two GPUs at tensor-parallel-size 2: shard the model across both cards, roughly halve the memory per card, pick up some throughput. On this host it hung. Not slowly. NCCL's peer-to-peer transport sat at 100 percent GPU utilisation with about 500 MB of VRAM in use and made no progress for ten minutes. torch.cuda.can_device_access_peer() returned True; the actual transfer never completed.
Disabling P2P with NCCL_P2P_DISABLE=1 pushed NCCL onto shared-memory transport and got further, and then TP=2 hung again on an internal handshake between vLLM's engine process and its worker (bug 5). Reproduced on two different hosts, on vLLM 0.26.0 and 0.27.1. A TP=1 versus TP=2 isolation test was decisive: TP=1 served cleanly every time, TP=2 hung identically every time, which ruled out a version-specific bug and pointed at the host's GPU topology (PCIe-only, no NVLink) on a virtualised Community Cloud host.
The fix was to stop. The whole live run happened at TP=1 on a single A6000, at half the hourly rate, losing the already-downloaded checkpoint on the pod switch. Multi-GPU serving was not required for anything the lab set out to measure. Recognising that a problem is not worth another two hours of paid debugging is a deployment skill in its own right.
What it cost
RunPod Community Cloud, RTX A6000, non-interruptible. Rates on the day were USD 1.06 an hour for the two-GPU pod and USD 0.53 for the single-GPU one. The live work ran across two pods and two sessions: one that stopped early on the TP=2 hang, one that took the full runbook end to end at TP=1. About five hours of billed pod time, roughly USD 4 all up, well under AUD 10.
Why a mock could not catch the bugs
None of the nine bugs found are clever. A mock of the vLLM server genuinely cannot reach some: the driver and CUDA mismatch (bug 1), the NCCL hang (bug 5), the 404 on an unaliased model name (bug 6). The mock stands in for the exact thing that behaves differently, so those only appear on real hardware.
The rest were plainer test-design gaps the live run just surfaced first: an error-rate function that only counted 5xx (bugs 6 and 8), a restart script that had drifted out of sync with the launcher (bug 7), a CLI argument passed the wrong shape (bug 9). A unit test could have caught those.
Code and Further Reading
- The lab: github.com/cchew/llm-deployment-lab (MIT). The README has the full runbook.
- Companion post: Running your own LLMs (for beginners), the vocabulary this one assumes.
- vLLM parallelism and scaling: docs.vllm.ai/en/latest/serving/parallelism_scaling.
- RunPod API reference: docs.runpod.io/api-reference/overview.
- NCCL environment variables: docs.nvidia.com/deeplearning/nccl/user-guide/docs/env.html.
AI Tools
Claude Code was used to build and run the deployment lab and to document the live-run findings, and Claude was used to draft this post from those notes.